|
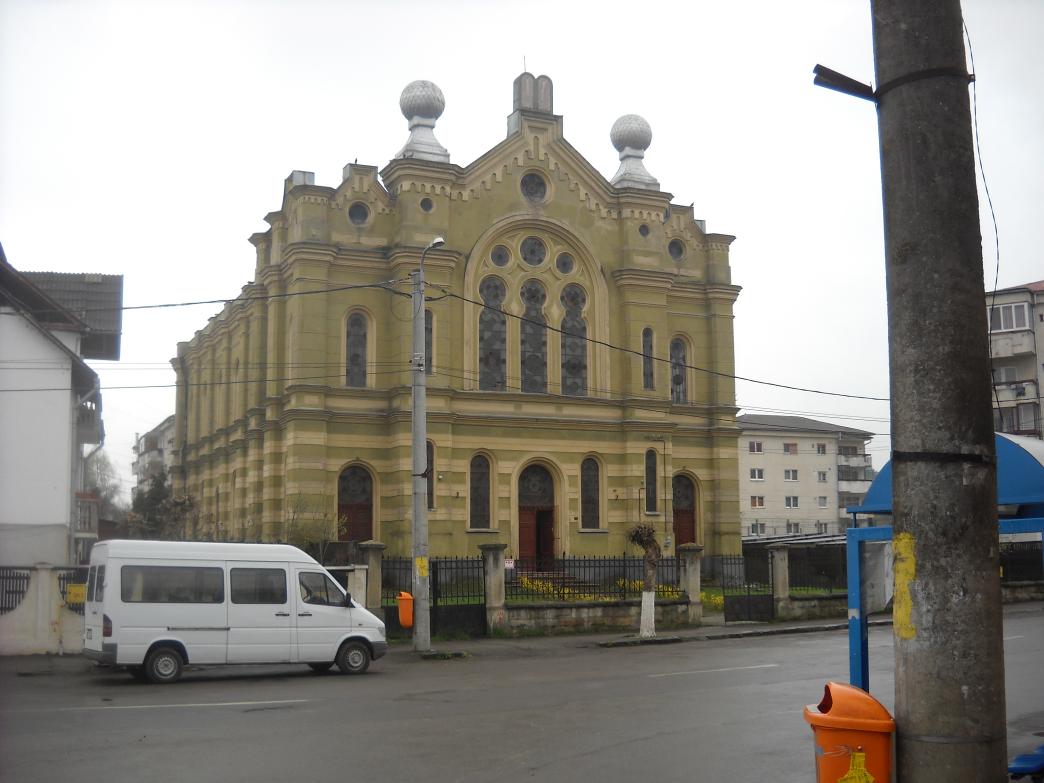
Romania the People’s Prison. Synagogue in Dej, (Hungarian Dés) The Hungarian speaking Jews have completely gone from Romania, they have been ethnically cleaned and sold for money by Nicoleau Ceausescu. As a consequence of these shameful acts there is no Jewish culture anymore in Dej. Romania is in fact a prison for its people, evidence for this is supplied by the Romanian National Statistical Institute , let’s have a look at the incriminating numbers : |
|
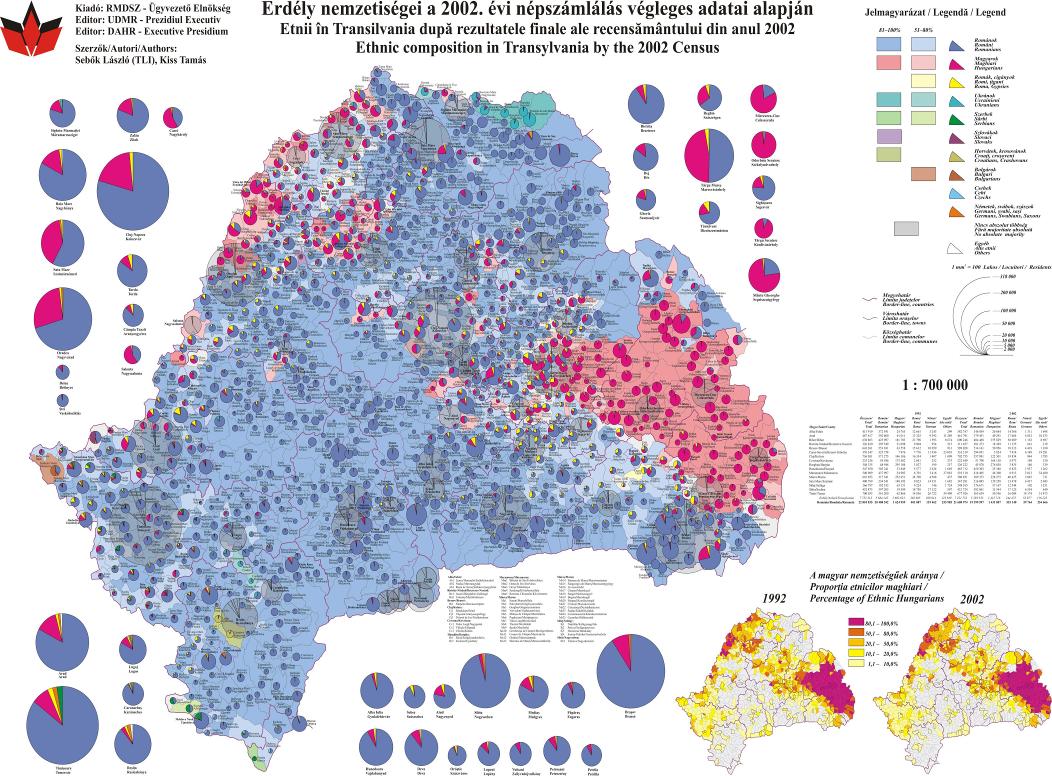
These are the official statistics from the Romanian government, and these statistics show that within 30 years all of Romania Jews and almost all Germans have been ethnically cleaned, at present day there are no Jews left, other minorities like Armenians have also completely vanished, so the remaining autonomous ethnic minorities have a good reason to fear the Romanian government, which is still not capable of respecting basic human rights. At present day ethnic Hungarians don’t dare to write Hungarian in public or to use Hungarians flags in public, although the Strasbourg treaty clearly defines the right for the free use of the Hungarian language. At Cluj-Napoca airport not even one word of Hungarian can be found, which reflects a deep racist attitude towards the autonomous minorities by the authorities. Romania is in fact the people’s prison, since it is not able to guarantee the rights of its own people such as ethnic Hungarians, ethnic Germans and ethnic Jews, no to speak about Armenians, below you will see an ethnic map of Transsylvania. |

|
Year |
Hungarians |
Germans |
Jew |
Roma |
Total Population |
|
1956 |
1 587 676 9.1 % |
384 708 2.1 % |
146 264 0.8 % |
104 216 0.5 % |
17 489 450 |
|
1966 |
1 619 592 8.5 % |
382 595 2.0 % |
42 888 0.2 % |
64 197 0.3 % |
19 103 163 |
|
1977 |
1 713 928 7,9 % |
359 109 1.6 % |
24 667 0.1 % |
227 398 1% |
21 559 910 |
|
1992 |
1 624 959 7.1 % |
119 462 0.5 % |
8 955 0.0 % |
401 087 1.7 % |
22 810 035 |
|
2002 |
1 431 807 6.6 % |
59 764 0.2 % |
5 785 0.0 % |
535 140 2.4 % |
21 680 974 |
|
2011 |
1 237 746 6.5 % |
36 884 0.2 % |
None 0.0 % |
619 007 3.2 % |
19 042 936 |